19 Free Business Analytics transparent PNG images
Welcome to our Business Analytics image collection, featuring over 19 free AI-generated images. Explore a diverse array of stock photos, 3D objects, vectors, and illustrations related to business analytics, data visualization, and decision-making. Enjoy high-resolution downloads and use our 'open in editor' feature to customize prompts for your perfect image.








Related Tags
Business analytics refers to the practice of using data, statistical analysis, and quantitative methods to derive insights and make informed decisions within a business context. This field combines elements of statistics, data science, and business intelligence to help organizations better understand their operations, identify trends, and optimize their strategies. The increased availability of large datasets and advancements in data processing technologies have made business analytics an essential tool for modern enterprises to gain a competitive edge.
Definition and Background of Business Analytics
Business analytics can be applied to a wide range of business functions, including marketing, finance, operations, and human resources. Some common applications include customer segmentation, demand forecasting, risk analysis, inventory optimization, and performance evaluation. Effective business analytics requires the ability to collect, clean, and analyze data, as well as the capacity to interpret findings and translate them into actionable insights. Characteristics of successful business analytics initiatives often include a data-driven culture, cross-functional collaboration, and the utilization of advanced analytical techniques such as machine learning and predictive modeling.
Key Applications and Characteristics of Business Analytics
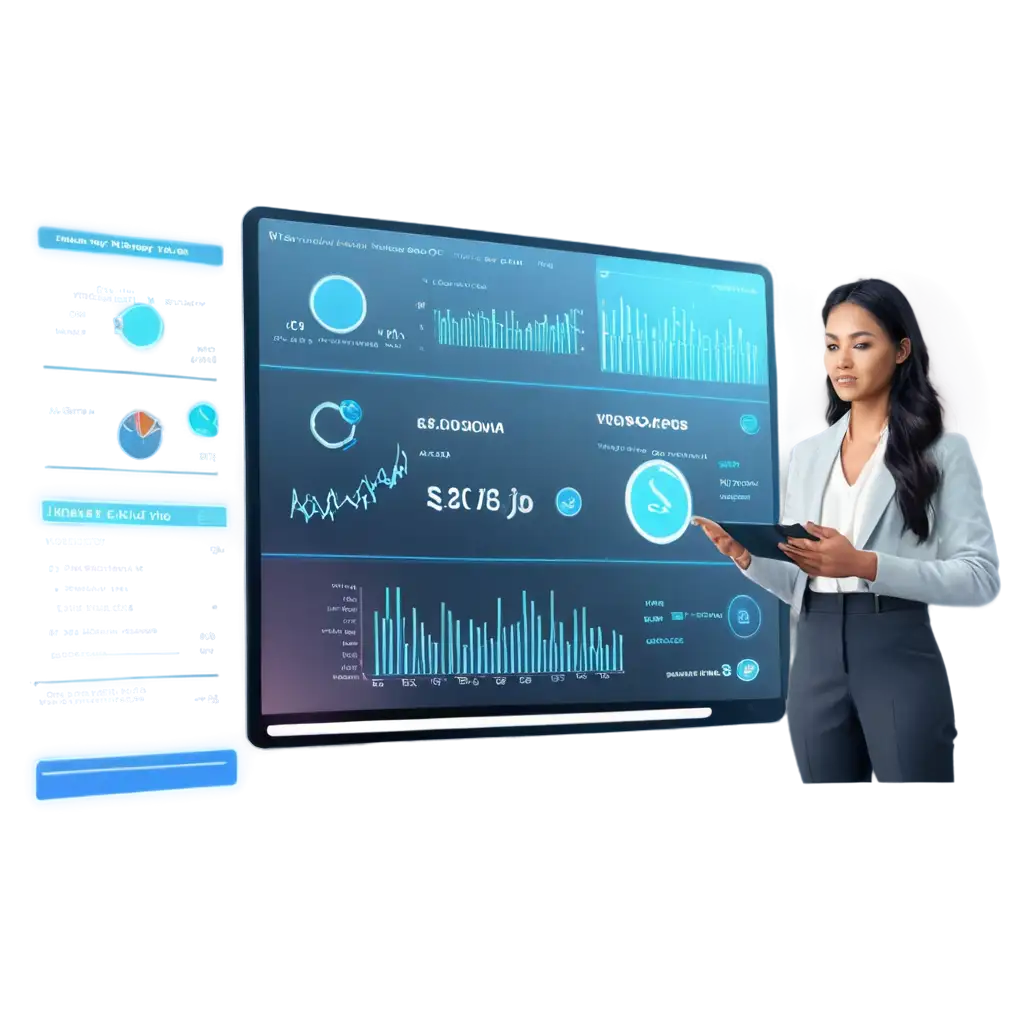
Business analytics often relies on visual representations of data to facilitate understanding and decision-making. Some of the most widely used visualizations in this field include bar charts, line graphs, scatter plots, and dashboards. These tools help businesses identify patterns, trends, and anomalies within their data. Additionally, specialized business analytics software, such as Tableau, Power BI, and Qlik, provide comprehensive platforms for data exploration, reporting, and interactive visualization. The integration of these tools with data sources and the ability to create custom visualizations are crucial for transforming raw data into meaningful, actionable insights.
Prominent Visualizations and Tools in Business Analytics
The increasing adoption of business analytics has had a significant impact on modern organizations. By leveraging data-driven insights, businesses can make more informed strategic decisions, enhance operational efficiency, and improve overall performance. Business analytics has enabled companies to better understand their customers, optimize their marketing strategies, manage risks more effectively, and streamline their supply chains. Furthermore, the integration of predictive analytics and machine learning has empowered organizations to anticipate future trends, identify growth opportunities, and stay ahead of their competitors. As the volume and complexity of data continue to grow, the importance of business analytics in driving organizational success will only continue to increase.
The Impact of Business Analytics on Modern Organizations